What is section 61?

Construction Resources

We have put together a detailed guide on section 61. From what it is, why it’s important and how to adhere to it easily and simply using our automated Noise, Vibration and Dust monitors.

Section 61 is commonly referred to when discussing construction or demolition related noise and vibration pollution impact on the environment. Section 61 of the Control of Pollution Act 1974 is referred to when a construction or demolition firm applies to the local authority for consent to carry out works, which are likely to have a significant impact on the neighbourhood due to its generation of noise and vibration. A section 61 application outlines the works which are planned to take place, the working hours of the site and a plan to mitigate potential noise and vibration impact by best practical means. 

WHY SHOULD A CONSTRUCTION OR DEMOLITION FIRM APPLY FOR A SECTION 61? 

A section 61 application demonstrates to the local authority a pro-active approach to reducing environmental impact, outlining what methods are in place to minimise disruption to the neighbourhood, thus reducing the number of potentials complaints. By having section 61 consent, a local authority may not issue a section 60 notice. Having section 61 consent in place minimises the likelihood of the contractor’s work being stopped, as a mitigation plan is already in place.

INFORMING THE COMMUNITY IS KEY TO REDUCING LIKELY COMPLAINTS?

Informing the community of your works and outlining how you plan to reduce environmental impact is likely to deter complaints. By notification, local communities are much more accepting of disruption as due to the section 61 application, there is demonstrated initiative to minimise any negative impact in the local community. Building a rapport with the community and regularly updating them of planned events shows consideration to the community and the environment they live in, which should ultimately help reduce complaints and demonstrate to the local authority you are reducing your impact in the community and on the environment. 

THE BENEFITS OF A SECTION 61 APPLICATION 

  • Reduced environmental impact
  • Consideration plans in place to help protect the community and reduce the number of complaints
  • Can protect you from further legal action – Section 61 can be used in an appeal against a noise abatement notice
  • Evidences that the developer has considered the environment and has set out to reduce environmental impact by best means practical
  • Reduced risk for your site to be penalised
  • Cannot be served a section 60 noise abatement notice

HOW A SECTION 61 AVOIDS LEGAL ACTION BEING TAKEN AGAINST THE DEVELOPER? 

Section 61 – Prior consent is an agreement between the developer and the council, which can outline a noise and vibration mitigation plan. With this agreement in place it protects the developer from legal action being taken under Section 60 of the Control of Pollution Act 1974 or Section 80 of the Environmental Protection Act 1990.

When must you apply for a section 61? 

As a developer, you must apply for a section 61 within 28 days before the intended works are to take place. If you have carried out any works prior to this date, except for any minor preparation, then a prior consent will not be issued. 

WHAT SHOULD BE INCLUDED IN A SECTION 61 APPLICATION? 

  • A site location plan with (NVD) noise, vibration and dust monitoring locations detailing the site boundary, nearby roads and railways
  • Nearest sensitive receptors or residential properties should be highlighted
  • The main contractor’s contact details (name, address, etc)
  • Objective of the works to be carried out i.e. demolition of a car park 
  • A method statement of the works that will be undertaken, outlining any phases of the works, machinery to be used and methods employed
  • The working hours of the site, including any exceptions
  • Evidence that noise, vibration and dust impact are considered, outlining how you will mitigate the impact on the environment, either by sound barrier or continuous monitors, for example

WHAT IS NVD?

  • NVD is a term created by Campbell Associates that abbreviates Noise, Vibration and Dust. This term is notably referred to in the construction and demolition industry where there is a requirement for continuous noise, vibration and dust monitoring.

WHY IS CONTINUOUS MONITORING BENEFICIAL FOR CONSTRUCTION AND DEMOLITION PROJECTS? 

Continuous monitoring enables the contractor to mitigate problems in real time and evidence noise, vibration and dust levels continuously. Real time monitors offer the contractor a useful tool to help prove or disprove complaints in question. As false claims can be made maliciously against a developer or contractor, having factual real-time NVD monitoring data can provide valuable evidence in any case.

For example, using a NoiseSens – Noise Monitor with an AI powered audio recording feature will help identify the reasons for a noise breach. A simple playback of an audio recording can help distinguish if the noise event was site related or not. I.e. a passing motorbike. Audio recordings can be played back on the Sonitus Cloud™️ via a mobile, laptop or computer. 

WHAT CAN I USE TO CONTINUOUSLY MONITOR NVD ON SITE? [USING A SIMPLE AND COST-EFFECTIVE SOLUTION!]

The Sonitus Cloud™️ allows for real time monitoring of noise, vibration and dust monitoring on site by uploading measured data to one platform. Such interfaces allow for seamless and cost-effective solutions for monitoring without the need to attend the site and download data. SMS and email warning alerts are instantly received for breaches so you can mitigate exceedances on site promptly.  

With the NoiseSens Noise Monitor we can measure noise continuously in real time. Instant alerts enable a fast reaction to noise events, which can help reduce or eliminate possible complaints from nearby residents. The NoiseSens monitor is a plug and play device, housed in a weather protective enclosure or integrated into a Dust monitor to continuously measure the noise level. Such a device is configured remotely, for site engineers to put power to the device and the monitor will automatically start-up and log without any human command prompt. 

Sonitus Cloud allows web integration of the remote Vibration Monitors, which silently communicate around the site via a cellular 2G & 3G connection. BS5228 specifies using a monitor that measures Peak Particle Velocity in 3 directions. The VibrationSens monitors use a simple-to-mount tri-axial geophone that can be fixed in many settings, such as to walls, to the ground or underground. Such systems save project engineers time and money compared to monitors that require regular weekly charging, configuration and downloading on site. Measuring vibration is important because the human response to vibration is particularly low (1mm/s can be felt and is likely to cause complaints), therefore low-level vibration can be perceived by residents of causing damage to their property.

Our air quality & dust monitors are used for measurement of fine particles. Such monitors will continuously monitor the dust levels on site and report the average readings to the Sonitus Cloud. Air Quality is a growing concern in the UK with an estimated 40,000 deaths per year because of poor air quality. The Sonitus Cloud will display real time warnings for dust exceedances and allows you to monitor and measure your work’s impact remotely.

CAN NOISE BE PREDICTED ON CONSTRUCTION AND DEMOLITION SITES? 

Yes! Using Datakustik CadnaA noise modelling software it is possible to predict noise levels at sensitive buildings and receptors. CadnaA allows the integration of Google maps, open street maps and imported drawings to map noise sources, terrains, model machinery, barriers and buildings in a CadnaA project. It is possible to accurately map the surrounding road and rail networks to realistically predict the noise levels at any point of any day in any given position. Appropriate noise barriers can be drawn in the model with the ability to demonstrate a before and after result, calculated and presented in a 3D print or 3D video presentation as the image above. The noise models can be presented to the local authority to demonstrate full consideration of the project site and visualise how you will effectively reduce the noise impact in the community.

WHAT IS A SECTION 60 NOTICE? SHOULD I CONSIDER A SECTION 61 AGREEMENT PRIOR TO UNDERTAKING WORKS?

A section 60 notices outlines to the developer or contractor a specific order of operation. This notice may outline conditions imposed on the site, such as a change in working hours, noise limits, plant or machinery that may or may not be used, and other site working methods. Best Means Practical on site should be considered by the local authority when issuing the notice in relation to minimising noise. With this insight, some argue it is far better to apply for a section 61 consent prior to undertaking works rather than later be issued with a section 60 order.

WHAT GUIDANCE IS AVAILABLE FOR NOISE AND VIBRATION CONTROL FOR CONSTRUCTION AND DEMOLITION SITES? 

Many local authorities now produce codes of practice for noise, vibration and dust control in their district. These codes of practice documents commonly refer to guidance and the limits set out in BS5228: 2014 Code of practice for noise and vibration control on construction and open sites parts 1 (noise) and part 2 (vibration) and the IAQM Guidance on the assessment of dust from demolition and construction. There is guidance on preferred mounting positions, mitigation and limits.

BS5228:2014 Code of Practice for Noise and Vibration Control also outlines recommendations for noise mitigation measures that should be considered. Noise limits are not set in BS5228; however, these can be easily determined by carrying out a background noise assessment prior to any works undertaken on site; the noise limit is implemented based on measured results. Some local authorities will outline noise limits within section 61 consent or referral to a code of practice written by the local authority. 

Vibration limits and guidance are clearly defined in BS5228:2014 Part 2 where limits for ‘human response to vibration’ and ‘cosmetic damage’ are defined in tables B1.1 and B1.2. The standard gives guidance and examples on actual measured vibration levels undertaken on working sites, with vibration results for various plant machinery at different distances. You will also find guidance on how to mitigate vibration to nearby sensitive receptors. 

WHERE SHOULD NOISE MONITORING EQUIPMENT BE INSTALLED ON A CONSTRUCTION SITE? 

Noise monitors are normally installed to the edge of the site boundary, nearest to sensitive receptors (the residential and commercial occupiers which are likely to be affected by the works). If practical, it is sometimes best to measure in various positions on site to cover more sensitive receptors if this is feasible. Limiting factors can be due to safety, security, power or the project scale. 

There are various power solutions for remote monitors; many monitors can run on 240-volt mains power, 110-volt generated power, battery power and/or solar power. Noise monitoring equipment should be calibrated within the recommend manufacture interval or according to the set standard you are working to. The instrument should be mounted according to the manufacture guidance and field calibrated, prior to undertaking any measurements. 

The microphone should be mounted in a free field (at least one metre away from any reflective facade or barrier) and mounted at a height of approximately 1.2 to 1.5 metres above ground level. The monitor should be mounted above the hoarding or a correction applied. 

HOW SHOULD VIBRATION MONITORING EQUIPMENT BE INSTALLED ON A CONSTRUCTION SITE?

The VibrationSens monitors can be fixed in soft ground, mounted to a heavy floor plate on a hard surface or bolted directly to a structural wall. When considering structural and human response to vibration it is common practice to measure Peak Particle Velocity in all three directions; transverse, vertically and longitudinally.

Vibration monitors may be installed to the edge of the site boundary nearest to sensitive receptors, fixed on or near to sensitive equipment or structures that need protecting. It is common to see numerous vibration monitors around a construction site, particularly where there are very sensitive receptors or complex building layouts that should be protected. Vibration monitors are commonly left for long periods of time in unsafe locations through the demolition and ground works phase, so it is always useful to have a monitor with a long battery life with cloud based connectivity.

It is important to highlight vibration monitors should be calibrated every 2 years in a certified laboratory.

References

BS5228 2014 Code of practice for noise and vibration control on construction and open sites parts 1 (noise) and part 2 (vibration) and the IAQM Guidance on the assessment of dust from demolition and construction.

Section 61 – https://www.legislation.gov.uk/ukpga/1974/40/section/61

Section 60 – https://www.legislation.gov.uk/ukpga/1974/40/section/60

City of West Minister Code of Practice – https://www.westminster.gov.uk/code-construction-practice

Manchester City Council – Guidance on completing an application for prior consent – http://www.manchester.gov.uk/download/downloads/id/24984/prior_consent_section_61_application.pdf

Chris Anderson @ Spectrum Acoustic Consultants – https://www.linkedin.com/pulse/section-61-applications-providing-information-chris-anderson

Able Acoustics – http://www.ableacoustics.com/Section_61_Consent.html

Cass Allen – http://www.cassallen.co.uk/section-60-and-61-notices

London’s ‘low emission zone’ for nrmm

Air Quality & Dust

BACKGROUND

Air pollution is one of the most significant challenges facing London. London is in breach of European legal limits for Nitrogen Dioxide (NO2) and many areas exceed safe limits for Particulate Matter (PM) as set by the World Health Organisation. The Mayor has proposed measures to tackle emissions from road transport in particular diesel vehicles. This is to be extended for NRMM relating to construction sites which is also a significant contributor to adverse Air Quality in London. Current estimates of emissions from NRMM used on construction sites are shown to be responsible for 7% of NOx emissions, 14% for PM2.5 and 8% of PM10 emissions across the Capital.

WHAT DO CONSTRUCTION AND DEMOLITION COMPANIES NEED TO DO?

In order to comply with the GLA’s NRMM LEZ policy there is a requirement for developments to keep an inventory of all NRMM used at the site. 

This inventory of all NRMM will state the emission limits for all equipment. All machinery should be regularly serviced and service logs kept on-site for inspection. This documentation should be made available to local authority officers as required.

The NRMM register is an automated online inventory which is handled at: http://nrmm.london/

Details of all NRMM with a net power between 37kW and 560kW should be recorded as it is delivered to the site with an indication of the proposed duration of use no matter how short or long this may be. If you know what machines will be used they can be entered in advance, this can be particularly useful where an exemption is required.

REGIONS COVERED FOR NRMM STANDARDS

This map shows the area of the Non-Road Mobile Machinery (NRMM) standards will apply. These standards have been active since 1st September 2015. There are two zones – Greater London (shown in blue), and the Central Activity Zone (CAZ) and Canary Wharf (shown in orange). The central London areas have a tighter emissions standard applied to them.

A Useful Practical guide can be seen here:

http://nrmm.london/sites/default/files/NRMM-Practical-Guide.pdf

Campbell Associates offer automated web based monitors for construction and demolition sites.  This includes PM10, PM2.5 particulate/ dust monitors, NOx, NO, NO2 ,  Noise and Vibration for sale and hire.

Comparison of aeroqual’s aqs-1 with mcerts approved reference analysers

Air Quality & Dust

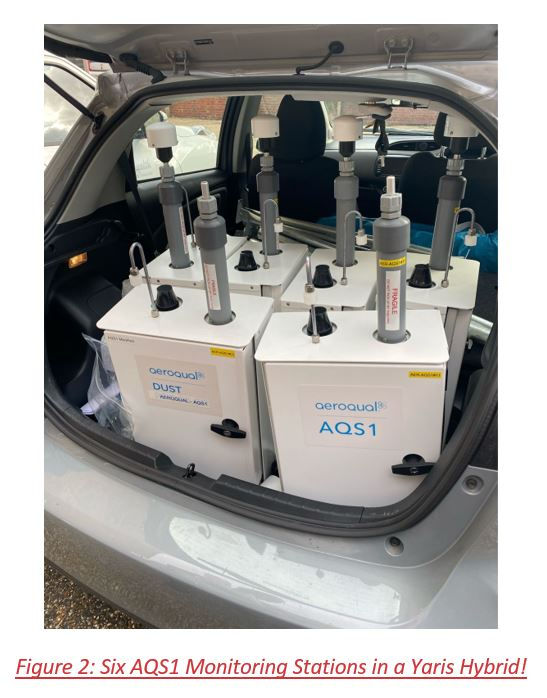
Until now we have referred to Aeroqual’s sensor technology as “Near Reference” but with the development of a new specific NO2 sensor combined with the AQS1’s reference flow technology we are now seeing data, from this tiny box, of the accuracy you would expect from a reference (MCERTS) analyser. This will allow you to get accurate data from confined spaces for NO2, Ozone, PM1, PM2.5, PM10 and TSP. Aeroqual’s unique technology means it can be calibrated directly from calibration gas on site for full QA/QC. LSO (site visits) are only required every 3-6 months so reducing operation costs and saving time. The simplicity of operation of this system further reduces operation costs and improves reliability and data capture rates. This is shown by the study below.

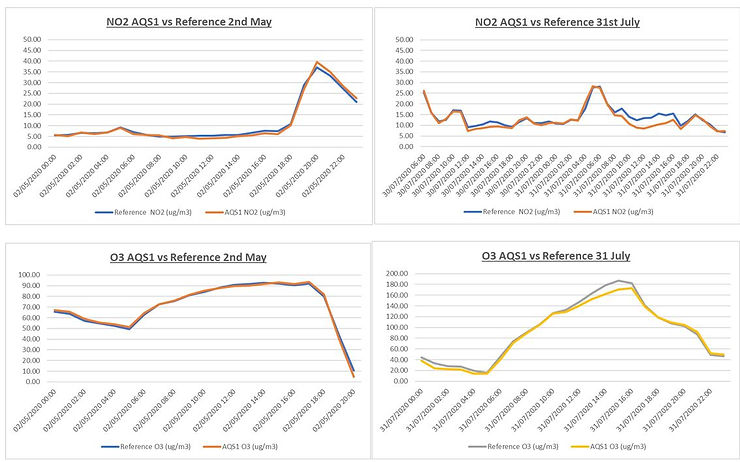
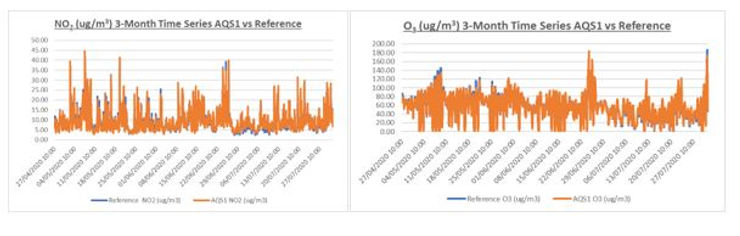
Comparison of AQS1 vs Reference NO2 over 3 Months:

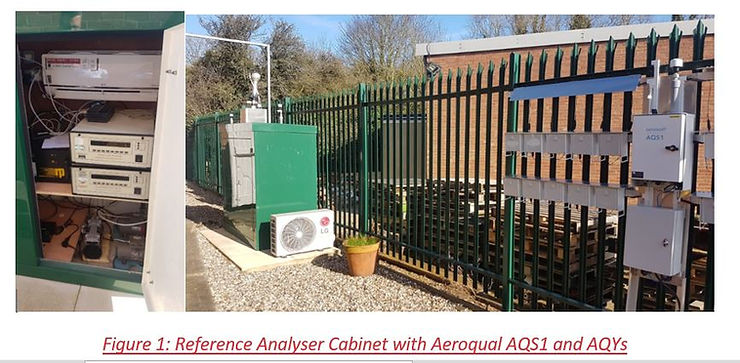
From April to July 2020 an AQS1 was operated close to our reference chemiluminescent NOx analyser (see figure 1). Neither instrument was adjusted during this period, so it has not been possible to apportion drift between the two instruments. However, the data does show just how closely the two analysers tracked each other over a period of more than three months without calibration or adjustment.

The graphs below show how closely the two instruments agreed over three months for when peaks in levels occurred near to the beginning and end of the trial.

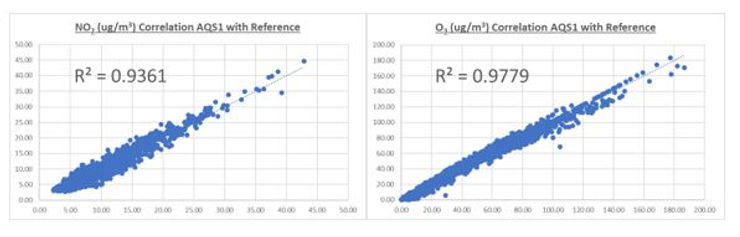
Three Month Regression Plots of Hourly Mean Values

The regression plots below show how the AQS1 agreed with the Reference analysers over the three months of the trial. Nitrogen Dioxide levels were unusually low during this period resulting in a lower R2 value for NO2 but correlation at the 40ug/m3 annual limit was excellent. Ozone levels were much higher at times and shows even better correlation, although this is mainly due to Aeroqual’s unique ozone measurement technology.

Time Series Plots and Data Capture

The reference NOx analyser was offline on 17th and 18th June due to a fault. A further failure occurred on 27th and 28th July. The trial was curtailed when both reference analysers were taken away for repair. The AQS1 showed no faults during the three months and is still in operation on 14th September. Data capture for the AQS1 was 100%.

Sensor selection -building vibration

Vibration

Vibration in Buildings and Structures – Selecting the correct Sensor for Measurement

Construction and demolition activities in urban areas requires consideration to how generated vibration from piling, excavation, blasting, movement of heavy plant and demolition may affect existing structures and services. Excessive vibration can cause nuisance to occupants and cosmetic damage to buildings and at higher levels it can cause more serious damage.

In order to evaluate the risks and monitor compliance it is commonplace to measure the vibration levels. Limits and guidelines are published in BS5228-2*, BS7385** and BS ISO 4866*** which indicate where vibration induced events may cause adverse response from people and damage to structures. These standards require that the vibration is measured in terms of peak vibration velocity, PPV.

Sensor Selection

It is possible to measure acceleration using an accelerometer and convert this to velocity, but it is not recommended for construction activities. With steady signals on a laboratory shaker it is possible, but in the real-world, vibration events are more complex and the process (integration) does not work so well.

The use of a sensor that gives a direct readout in terms of the metric specified in the standard is recommended. A direct reading vibration velocity sensor, also known as a geophone will give better results and less uncertainty, rather than trying to process the result. Geophones are routinely used for this reason

Advice on this subject is given in ISO 4866:2010, Section 8.2

“It is better to use an appropriate transducer to measure the required quantity directly and avoid the process of integration or differentiation.”

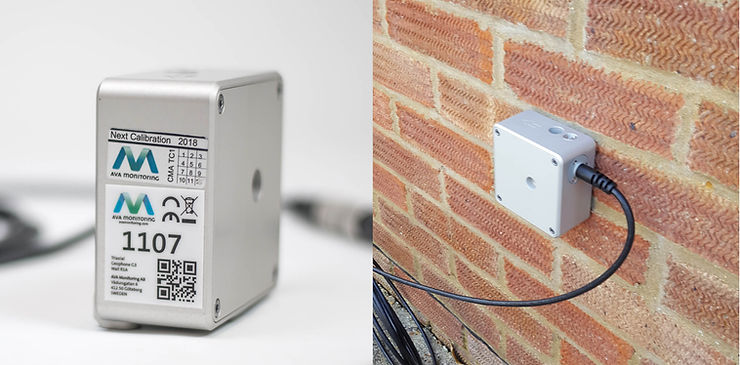
Figure 1 AVA Triaxial Geophone

Sensor mounting – It is better to have a free-standing sensor that can be directly mounted onto the structure to be monitored, as this provides direct coupling between source and instrument without the complexity of associated electronic correction networks. It also means that the sensor can be accurately calibrated to ensure ongoing compliance.

Power saving – Geophones will be more power efficient as energy required to make the complex conversions is not required.

*BS 7385-1: 1990 Evaluation and measurement for vibration in buildings. Part 1: Guide for measurement of vibrations and evaluation of their effects on buildings

**ISO 4866:2010 Mechanical vibration and shock – Vibration of fixed structures – Guidelines for the measurement of vibrations and their effects on structures

***BS 5228-2:2009 Code of practice for noise and vibration control on construction and open sites – Part 2: Vibration

Why monitor cracks in buildings – construction & demolition services

Construction Resources

Observing the appearance of and measuring the change in crack width is a popular technique used to assess structural damage of buildings. Cracks are one of the first signs that there has been movement of the structure due to ground movements.

Typical ground movements associated with demolition and construction activities:

Heave When large structures are demolished there can be an upward movement of the ground beneath nearby structures as a result of soil expanding.

Settlement (also known as compaction) Downward movement as a result of soil being compressed by the weight of a building after construction.

Subsidence The ground beneath a building sinks which usually occurs when the ground loses moisture and shrinks. Areas with clay soil can be more susceptible. Changes to a water course, removing trees and vegetation and collapsing drain can all contribute to subsidence.

Landslip Downward movement of sloping ground.

Cracks can also indicate if there has been stress on the structure due to excessive transient and cyclical vibration. Guidance on vibration from construction and demolition activities is provided in BS5228-2 Code of practice for noise and vibration control on open sites.

Monitoring Crack Movement techniques The traditional method for measuring cracks is by installing a manual crack monitor

Figure 1 Manual crack monitor

Once the monitor is in position across a crack, movement can be read from the device and noted by the engineer during a construction project. This relies on regular site visits and good note keeping.

Automated Crack Monitors

In recent times it has become more popular to use digital crack monitors which can be linked to data loggers for remote access and to send you alarms if there are significant changes. The sensors often record temperature at the same time to display how a crack varies as structures naturally heat and cool. Data is typically displayed on a cloud platform at an hourly resolution for easy and complete analysis.

Figure 2 Ellitrack digital crack monitor and logger

The system should be left in place for as long as possible for you to build a picture of evidence to assess if the movement is still accruing and the direction. Modern loggers can run on internal batteries for several years to remove the need to visit site.

For further details please see https://www.campbell-associates.co.uk/crack-monitor

Where to fit indicative noise, vibration & dust monitoring on construction sites

Construction Resources

Noise, vibration & dust monitors are typically installed at the edge of the site boundary, nearest or at sensitive receptors of those likely to be affected by the work. For example, sensitive receptors can include anything from local services such as; power, gas & water mains, underground services, public, residential or commercial buildings, and even road and rail.

When commissioning monitors on-site, special attention should be made to the local conditions and the best practical mean (BPM) should apply. Real-time monitors should be commissioned according to any standards set out by the local authority, client or third parties. Should there be an absence of this information, it is typical to refer to ‘code of practice for noise & vibration control on construction and open sites – BS5228’. For guidance on dust and air quality, it is typically common to refer to World Health Organisation limits, but further guidance is typically resourced from IAQM for construction and demolition sites.

These available resources give clear instructions to site managers and engineers on where and how best to install equipment on site. For example, the microphone from a noise monitor should be mounted in a free field (at least one metre away from any reflective façade or barrier) and mounted at a height of approximately 1.2 to 1.5 metres above ground level. When mounting the microphone to hoarding the microphone should be mounted above the hoarding or a correction applied.

The positioning of dust monitor samplers inlet should be located in a clear, unobstructed position, and some metres away from any large structures (such as walls of buildings and welfare cabins) that might interrupt airflow. Above the inlet, it should be open to the sky with no overhanging trees or other structures. The air inlet should be ideally mounted between 1.5 to 4m above ground level.

Where monitoring concentrations of PM10, sensors may be located upwind and downwind of the site, but in complex urban areas, this may be difficult to determine, therefore additional monitoring points may be required. On low-risk sites, one monitor could suffice, but it is typical to have one dust and noise monitor on each boundary of the site for directivity of the pollution.

Vibration monitors can be fixed in various ways depending on the application, and selecting the appropriate sensor is important. The measurement sensor must be fitted appropriately according to the required works, standards and guidelines and therefore more measurement points may be required. The sensor of the vibration monitor should be fit to a solid surface, such as a floor, wall or heavy metal floor plate and mounted inset distances horizontal or vertically dependent on the measurement interest. For further advice on commissioning a noise, vibration or dust monitor, please get in touch with one of your local technical sales engineers.

Why you should be monitoring no2 on construction & demolition sites

Air Quality & Dust

CONSTRUCTION SITES AND NO2

It is well known that construction sites can generate and emit many different forms of pollution,

the most obvious being material waste, visible dust, noise and vibration. However, construction and demolition sites also produce less obvious pollutants which are of serious concern for human health and impact on the environment. Two of these pollutants are the gas nitrogen dioxide (NO2) and fine dust particles called particulate matter. (PM) It is estimated that in London, NRMM (Non-

Road Mobile Machinery) contributes to 7% of NOx, 14% of PM2.5 and 8% of PM10 and it is believed to be a similar situation in other major conurbations.

NRMM on construction sites generate NO2 from diesel or gasoline fuelled engines in trucks, excavators, loaders, bulldozers, mobile cranes, off-road machinery and static engines such as pumps and electricity generators. Idling engines are a significant contributor to NRMM emissions and personal exposure to PM2.5, PM10 and NO2. It is estimated that 15% of diesel fuel consumed per year in the UK is associated with NRMM, which equates to approximately 4 billion litres.

HOW IS NO2 GENERATED?

Combustion of fossil fuels produces oxides of nitrogen (NO2). NOx is primarily made up of nitric oxide (NO) and nitrogen dioxide (NO2). NO2 is of most concern due to its impact of health. However, NO easily converts to NO2 in the air – so to reduce concentration of NO2 it is essential to control emissions of NOx. National ambient air quality standards set NO2 as a criteria pollutant and indicator of the larger group of nitrogen oxides.

HEALTH EFFECT OF NO2

Scientific evident links short-term NO2 exposures with adverse respiratory effects including airway

inflammation in healthy people and increased respiratory symptoms in people with asthma. Studies also show a connection between short-term exposure and increased hospital admissions for respiratory illnesses. In addition to contributing to ground-level ozone effects on the respiratory system, NOx reacts with ammonia, moisture and other compounds to form small particles. These small particles can penetrate deeply into sensitives parts of the lungs. Recent research shows children exposed to diesel-dominated air pollution in London are showing poor lung capacity, putting them at risk of lifelong breathing disorders. The study was led by Kings College London, Queen Mary University of London and the University of Edinburgh.

WHAT IS NEW IN NO2 MEASUREMENT?

Aeroqual provide real-time dust sentry monitors for accurate measurement of dust and particulates, (PM) which are widely used across the UK on construction sites. These monitors now have the option of being upgraded to accurately measure NO2 in parallel with dust and particulates. The systems have advanced patented sensors and an active pumped air flow to sample NO2 to near reference standards giving a reliable picture of key pollutants on site. Data is stored and uploaded to a cloud each minute of alerting and reporting. In the past diffusion tubes have been used to measure NO2 concentrations in communities. These are passive devices which measure the average concentration typically over 1 month. NO2 concentrations are usually required as an hourly period, and for construction projects during working hours. These limitations of diffusion tubes make new real time NO2 monitoring an attractive proposition. Newer dust sentry and profiler monitors can be upgraded now and brand new AQS (Dust & Gas units) can be purchased or hired today.

The dust Sentry AQS can also measure Ozone and VOC’s. For more information on air quality monitoring click here.

Not just another small air quality sensor system

Air Quality & Dust

The AQS’s new NO2 analyser module can not only be calibrated directly from gases on site, but it has also shown to have such a stable calibration that this may only be required every 1 or possibly every 2 years. This means that, not only can you be confident that the data is reliable long term. It also means you do not have to factor in the cost of routine “LSO” visits to site.

How is this possible? Unlike other apparently similar systems, the AQS has a flow through system which switches sample air with internally generated zero air so it is, in effect, being zero checked continuously. This together with the stability of the sensor used gives it its unrivalled measurement stability.

To prove this we ran our reference AQS1 (number 847) next to an MCERTS reference chemiluminescent NOx analyser last year as we described in our earlier case study ( https://www.campbell-associates.co.uk/post/comparison-of-aeroquals-aqs-1-with-mcerts-approved-reference-analysers ) carried out for three months between April and July 2020. This shows how the two continued to agree over the whole period to a remarkable degree. More recently (March 2021) we have had the same AQS1 NO2 independently checked against reference gases and this has shown the NO2 values are still correct when operating on the factory calibrations from January 2020. Such calibration stability is unheard of.

Calibration March 2021

Method

Calibration was carried out using GPT (Gas Phase Titration). This is the same equipment as is used to check the calibration and converter efficiency of chemiluminescent NOx analysers and as such this type of equipment is already used on site.

NO2 (Nitrogen Dioxide) was generated by mixing NO (Nitric Oxide) with O3 (Ozone) in a balance of zero air. In the test below calibration gases were fed to both the AQS1 and an MCERTS reference chemiluminescent NOx analyser. Gases were also fed to a reference. To start with NO from a certified high concentration gas standard cylinder was first diluted with zero scrubbed ambient air to create a 250 ppb standard. Neither analyser responded. The ozonater was then switched on and titrated with the NO to create an NO2 250 ppb standard. The same was then used to generate a 90 ppb standard. The NO was then switched off and the analysers tested at 90 and 250 ppb. The results are shown below.

Results

Conclusions

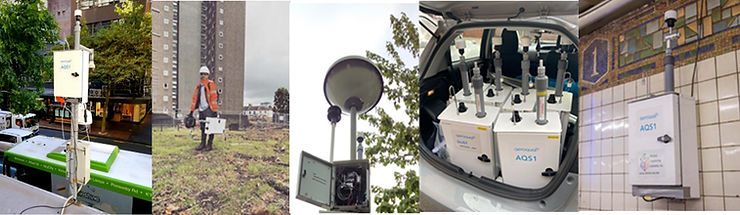
The calibration data proves how stable the AQS1 is over a long period of time (more than 12 months) without any adjustment. It also shows that the NO2 module in the AQS1 is extremely selective and has no response to either NO or O3. Data from the AQS1 was not only close to the traditional “reference” analyser but proved to be far more stable than would be expected from a chemiluminescnet NOx analyser. It is also small enough to be easily moved and installed without an air-conditioner. Indeed it can be carried in one hand and can even be installed on a lamp-post.

Crack & vibration monitoring at Barnes Bridge London

Project Updates

Dukes Meadow Footbridge

Vibration Monitoring, Barnes Bridge – London

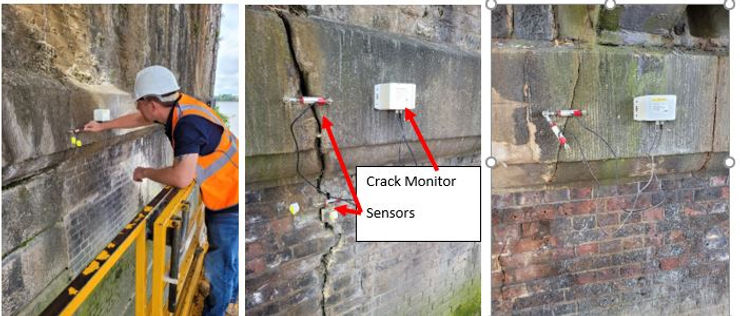
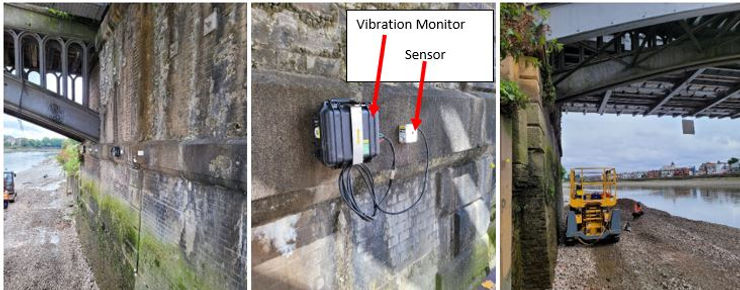
For the construction of the new footbridge, crack and vibration monitors were installed to monitor potential damage on the footings of Barnes Bridge, which crosses the Thames in the London Borough of Hounslow. All monitors are fully automated with batteries lasting several months for vibration and years for crack monitors. Each crack monitor has 2 sensors connected to precisely measure the crack distance and report data hourly to the cloud-based management system for alerting and reporting. Temperature is also measured in parallel to help establish the natural movements of the structure as it heats and cools.

Vibration monitors were also installed with triaxial geophone sensors to precisely measure construction generated vibration in the structure. They measure peak vibration velocity in three directions and upload data to the same web based system for alerting and reporting.

The fully automated nature of the sensors and management software means that the monitoring is low maintenance and efficient to run with the knowledge that project managers will quickly be alerted to any potential damage to the bridge. Cracks are one of the first signs that there has been movement of a structure due to ground movements or excessive vibration. Measuring the change in crack width is a popular technique to assess potential damage.

About Dukes meadows Dukes meadows comprises 75.5ha (187 acres) of parkland located in the London Borough of Hounslow, adjacent to the river Thames and downstream of Barnes bridge. It is one of the largest open spaces in London, offering open access to the Thames through the Thames path. The council is following the development of its ambitious plans to regenerate Dukes Meadows and deliver an improved public realm and sporting facilities. Construction undertaken by Knights Brown.

How to avoid a vibration breach fine #tricksofthetrade

Construction Resources

Understanding vibration levels and limits accurately is critical. So ensuring the device measuring the vibration is installed correctly is paramount. Our favourite device for measuring vibration in terms of protecting buildings and structures is the AVA-M80 vibration monitor with a tri-axial geophone. This unit will measure the Peak Particle Velocity in 3 directions and provide real-time email and SMS alerts as well as having a long term 8-month battery life.

Vibration limits are mentioned in BS5228-2 for construction and demolition works on open sites. Below are a few steps that should be taken when measuring according to the standard and guideline, in terms of the limits only. These points are general observations of the standard, and you should employee a qualified engineer to make an assessment on project and practice before commencing any works as these notes do not cover all important considerations when measuring vibration.

Step 1.

Identify who or what we are protecting. In BS5228-2, there are two tables with defined limits, one for human perception and one for structural damage. Let’s focus on structural damage only.

Step 2.

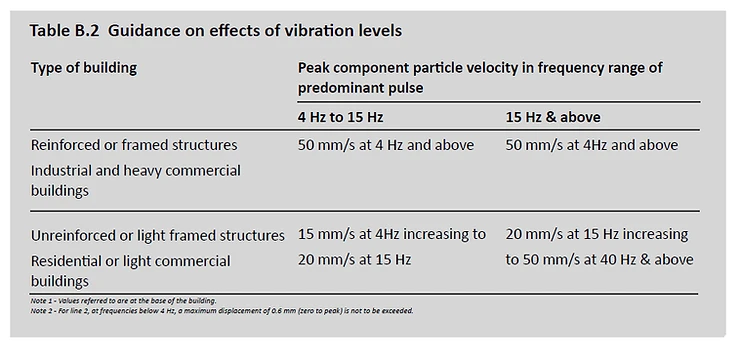
Identify the type of building. What are the limits? They are noted in Table B2.

Step 3.

Take note of the frequency range and limits accordingly. Notice how the vibration limits increases with frequency, but generally a lower limit for all is normal used, assuming the vibration sensor is setup to the correctly filter profile and standard. If we know the frequency and the level, potentially we can avoid a breach which is why the AVA-M80 monitor can collect this dataset with vibration waveform data.

In the table you will see at 4Hz the vibration limit is 15mm/s for cosmetic damage right up to 50mm/s at 40Hz.

Note that Figure B.1 refers to cosmetic damage! What is cosmetic damage?

  • Cosmetic damage is usually considered as the formation of hairline cracks on drywall surfaces, or the growth of existing cracks in plaster or drywall surfaces; in addition, the formation of hairline cracks in mortar joints of brick/concrete block construction.

In the standard it also documents other types of damage such as:

  • Minor damage is considered the formation of large cracks or loosening and falling of plaster or drywall surfaces, or cracks through bricks/concrete blocks.
  • Major Damage to structural elements of the building, cracks in support columns, loosening of joints, splaying of masonry cracks, etc.

So, what are the limits for Minor and Major damage? Well as the standard mentions.