pagecreative, Author at Campbell Associates

Noise Nuisance Investigation

Environmental Health

Sound level meters are used in noise nuisance and domestic environments to assist with resolving complaints between neighbours. These instruments are deployed by housing officers within local authorities and housing associations to record and capture noise events as evidential material where a disturbance is alleged.

The systems are commonly referred to as noise nuisance recorders or noise monitoring kits. They are typically based on established sound level meter platforms such as the Norsonic Nor140 or Nor145 NNR kits and the Larson Davis 821 SoundExpert NNR kit, supplied exclusively in the United Kingdom by Campbell Associates. The abbreviation NNR has become widely adopted as a general term for this type of equipment.

Noise recordings are supported by event logs completed by the resident, which accompany each captured event. The devices log sound pressure levels in decibels to assess the impact and pattern of noise. As measurements are taken within the complainant’s property, background levels are often relatively low, meaning internal sounds may also be detected. For this reason, audio recordings are essential to assist with identifying the source of disturbance, such as dog barking, amplified music or raised voices.

With a plotted noise trace and synchronised audio recording, it is possible to visually examine changes in sound level over time and describe frequency characteristics. Low frequency content is often emphasised in frequency analysis displays when music is present, while impulsive sounds such as dog barking appear as sharp spikes in the level trace.

NNR Kit 821 SoundExpert

Modern instruments use sophisticated pre trigger technology to capture audio prior to the moment the resident presses the event trigger. This ensures that the build-up to the disturbance is recorded, even if there is a delay in activation. By the time the resident attends to the instrument and presses the trigger button, the relevant event has already been captured, thereby strengthening the evidential quality of the recording and improving reliability in reporting and investigation.

It is critical that equipment is not only technically advanced but also simple to operate. The Larson Davis 821 SoundExpert NNR kit has been developed to provide a cost-effective solution for an industry operating within tight budgets, where reliable performance is required without the expense typically associated with high specification acoustic systems.

Demand for monitoring equipment has increased since the COVID pandemic, largely due to more people working from home and becoming more aware of neighbouring noise in domestic settings.

Why you should be monitoring NO2 emissions on construction and demolition sites now.

Air Quality & Dust

CONSTRUCTION SITES AND NO2

It is well known that construction and demolition sites can generate and emit many different forms of pollution, the most obvious being material waste, visible dust, noise and vibration. However, construction sites also produce less obvious pollutants that are of serious concern for human health and have a wider environmental impact. Two of these pollutants are the gas nitrogen dioxide (NO2) and fine dust particles known as particulate matter (PM).

It is estimated that in London, NRMM (Non-Road Mobile Machinery) contributes to 7% of NOx, 14% of PM2.5 and 8% of PM10, and it is believed that a similar contribution exists across other major UK conurbations. This highlights the growing importance of construction site air quality monitoring.

NRMM used on construction sites generates NO2 emissions from diesel or gasoline-fuelled engines, including trucks, excavators, loaders, bulldozers, mobile cranes, off-road machinery and static engines such as pumps and electricity generators. Idling engines are a significant contributor to NRMM emissions and personal exposure to PM2.5, PM10 and nitrogen dioxide (NO2).

It is estimated that 15% of diesel fuel consumed annually in the UK is associated with NRMM, equating to approximately 4 billion litres, reinforcing the need for effective air quality monitoring on construction sites.

HOW IS NO2 GENERATED?

The combustion of fossil fuels produces oxides of nitrogen (NO2). NOx is primarily made up of nitric oxide (NO) and nitrogen dioxide (NO2). NO2 is of most concern due to its impact of health. However NO easily converts to NO2 in the air – so to reduce concentration of NO2 it is essential to control emissions of NOx. National ambient air quality standards set NO2 as a criteria pollutant and indicator of the larger group of nitrogen oxides.

HEALTH EFFECT OF NO2

Scientific evidence links short-term NO2 exposure with adverse respiratory effects, including airway inflammation in healthy individuals and increased respiratory symptoms in people with asthma. Studies have also shown a clear association between short-term exposure and increased hospital admissions for respiratory illnesses.

In addition to contributing to ground-level ozone formation and its effects on the respiratory system, NOx reacts with ammonia, moisture and other compounds to form fine particulate matter. These particles can penetrate deeply into sensitive areas of the lungs, increasing long-term health risks.

Recent research shows that children exposed to diesel-dominated air pollution in London exhibit reduced lung capacity, placing them at risk of lifelong breathing disorders. This study was led by King’s College London, Queen Mary University of London and the University of Edinburgh, underlining the public health importance of monitoring NO2 emissions from construction activity.

WHAT IS NEW IN NO2 MEASUREMENT?

Aeroqual provides real-time dust sentry monitors for accurate measurement of dust and particulate matter (PM), which are widely used across the UK on construction sites. These monitoring systems can now be upgraded to provide real-time NO2 monitoring, allowing nitrogen dioxide measurements to be captured alongside dust and particulates.

The systems use advanced patented sensors and an active pumped airflow to sample NO2 at near-reference standards, providing a reliable picture of key air pollutants on construction sites. Monitoring data is uploaded to the cloud every minute, enabling continuous alerting, reporting and compliance monitoring.

Historically, diffusion tubes have been used to measure NO2 concentrations in surrounding communities. These passive devices typically measure average concentrations over a one-month period. However, NO2 monitoring on construction sites often requires hourly data, particularly during working hours, making diffusion tubes unsuitable for active site management.

These limitations make real-time NO2 monitoring systems an increasingly attractive and effective solution for construction and demolition projects.

Newer dust sentry and profiler monitors can now be upgraded, while purpose-built air quality stations (AQS) can be purchased or hired today. For more information on NO2 monitoring and construction site air quality, please contact Campbell Associates.

Air pollution and uk schools – public awareness of the issue grows

Air Quality & Dust

AIR POLLUTION IN AND AROUND SCHOOLS IS IN THE NEWS FREQUENTLY:

Thousands of British children exposed to illegal levels of air pollution – Exclusive: More than 2,000 schools and nurseries close to roads with damaging levels of diesel fumes – Full article

London’s most polluted schools to be given air-quality audits – Mayor Sadiq Khan announces first 50 schools to undergo audits to help identify measures to minimise the impact of pollution on children – Full article

Reports from the WHO and UNICEF site studies that show air pollution hits children harder than adults. The following excerpt from the WHO report makes the case clear:

The evidence also shows a relationship between exposure to ambient air pollutants and adverse effects on the development of lung function. Reversible lung function deficits, chronically reduced lung growth rates and lower lung function levels are associated with exposure to air pollution. Moreover, the evidence shows clearer relationships for particulate matter and traffic-related air pollution (indicated by nitrogen dioxide) than for other pollutants. Based on current knowledge, air pollutants seem to interact with other environmental factors, such as allergens, viruses and diet, that influence the overall impact of air pollutants on children’s health.

Children spend up to 40 hours a week in school or in childcare facilities. Put another way, that’s almost 50% of the time they spend awake. So it’s little wonder that parents are eager to understand what steps teachers and administrators are taking to 1) quantify the problem, and 2) manage the effects.

Part of the problem is the location of most schools. Urban schools are often located near major roads – so they are easy for a majority of the school population to access.

There is plenty that can be done. The National Education Union and British Lung Foundation have teamed up to provide schools with guidance.

Aeroqual offer cost effective, simple and accurate system to help quantify and monitor key pollutants. This helps and inform and educate pupils, staff and local administrators on the issues facing schools particularly in urban areas.

Peak particle velocity – why do we monitor it?

Construction Resources

With increasing activities in and around our cities the importance of vibration has become a prominent feature. You might have heard of PPV, but what exactly is it and how does that affect us and our projects?

VIBRATION (PPV) – ALL THE ANSWERS!

What is vibration and where does it come from?

Ground vibrations are associated with different types of elastic waves propagating through the ground. These are surface waves, and bulk longitudinal waves and transverse waves (or shear waves) propagating into the ground depth. Typical frequency range for environmental ground vibrations is 1 – 200 Hz. Waves of lower frequencies (below 1 Hz) are usually called microseisms, and they are normally associated with natural phenomenae, e.g. water waves in the oceans.

Ground vibration is measured in terms of Peak Particle Velocity (PPV) with units in mm/s or mm/s-1. It should be noted that the PPV refers to the movement within the ground of molecular particles and not surface movement. The displacement value in mm refers to the movement of particles at the surface (surface movement).

Environmental ground vibrations generated by rail and road traffic may cause annoyance to residents of nearby buildings both directly and via generated structure-borne interior noise. Very strong ground vibrations, e.g. generated by heavy lorries on bumped roads, may even cause structural damage to very close buildings. Typical values of ground vibration particle velocity associated with vehicles passing over traffic calming road humps are in the range of 0.1 – 2 mm/s.

The main sources of ground vibrations at construction are pile driving, dynamic compaction, blasting, and operation of heavy construction equipment. These vibrations may harmfully affect surrounding buildings, and their effect ranges from disturbance of residents to visible structural damage.

Why do we monitor and what are the limits?

Ground vibration can cause serious structural damage but can also be a nuisance to local residents. There are clear limits mentioned for vibration due to construction/demolition in BS 5228-2. In table B.1 – page 36 of BS 5228-2 you will find the guidance on effects of vibration levels. These levels set out the human response to vibration, as in nuisance. When we look at potential damage to buildings table B.2 comes into place. Depending on the type of building there are different limits which are generally higher than the nuisance limits. In general, magnitudes of ground vibrations that are considered to be able to cause structural damage to buildings are above 15 mm/s.

Every ground vibration can be recorded and measured automatically. Since it is simple for everyone to protect people, buildings, infrastructure, soil, air and watercourses from negative environmental impact these days we see more and more demand for continuous automated monitoring so construction & demolition can move forward and communities can be developed with minimal disturbance.

To minimize the impact of vibration caused by construction & demolition works governing bodies often set limits that are aimed to protect individuals from levels likely to cause nuisance and potential cosmetic damage to buildings. You will often see limits of 10 mm/s which is a level likely to cause complaints and is close to the level of potential cosmetic damage in lightweight structures.  Amber alerts can also be sent at lower levels to give warning that vibration levels are getting closer to the limits.

It is also useful to store a waveform (very detailed data) when high vibration levels are recorded. This enables you to investigate the actual frequency content of the vibration event. BS 5228-2, table B.2 gives separate limits by frequency which can therefore be accurately assessed.

Please note that the levels in the tables below are for guidance.  You will see separate guidance/ limits on vibration close to historic buildings, utilities infrastructure and sensitive measurement equipment found in universities and hospitals.

HOW CAN CAMPBELL ASSOCIATES ASSIST YOU?

Our vibration monitors, processes and temporarily stores measurement data from vibrations and air shock waves locally in the instrument. Measurement data is automatically transmitted over the mobile phone network and the Internet to the Sonitus Cloud; our web-based measurement system according to an individual and adjustable schedule. Alerts are automatically sent by e-mail and SMS to those responsible when a measurement is registered that exceeds set limits or if a failure occurs, such as a cable break.

The monitor is fully automated and has full remote access to view & download data, print reports, set alerts and change settings. They are easy to install, maintain and can easily be relocated on site to ensure you can work confidently on site knowing you are working safely within vibration limits.

References:
Skipp, B.O. (ed), Ground Dynamics and Man-made Processes, The Institution of Civil Engineers, London, 1998.
Krylov, V.V. (ed), Noise and Vibration from High Speed Trains, Thomas Telford Publishing, London, 2001.
Santos, J.A. (ed), Application of Stress-Wave Theory to Piles: Science, Technology and Practice, IOS Press BV, Amsterdam, 2008.
Bull, J.W. (ed), Linear and Non-linear Numerical Analysis of Foundations, Taylor & Francis, New York, Abingdon, 2009.
AVA Monitoring – http://avamonitoring.com/en/vibration-measurement/ 2017

Vibration measurements from sheet piling

Construction Resources

VIBRATION MEASUREMENTS FROM SHEET PILING

The ‘press in’ technique is a popular method of sheet piling on sensitive sites as it produces less noise and vibration that traditional dynamic systems.

This short article discusses vibration measurements made of a test pile and discusses why levels were higher than expected.

The process

The steel U sections are loaded onto the system and these sheets are gripped by a plier.  Varying pressure of up to 150 tons is applied to the sheet to insert it into the ground.  This is performed in stages, where the pile is inserted using downwards force and then lifted vertically before applying downward force again.

For this investigation an AVA M60 vibration monitor with triaxial geophone was placed 2.8 meters from the test pile.  The process takes several minutes for each sheet and this is dependent on ground type and conditions.

Figure one shows the measurement position and rig under investigation

Figure 1 – Measurement position

The PPV (Peak Particle Velocity) vibration levels in each 3 orthogonal directions can be seen in figure two. 

Figure 2 – Measurement data

The vibration levels increase as the pile gets deeper.  On this occasion vibration levels were higher than expected towards the end of the process.  The operator reported that the pile had hit limestone and this generated more vibration as the rig needs to apply more pressure to insert the sheet.

However, the detailed time history in figure 3 shows that the highest PPV recorded is where the pile is pulled up in a vertical position and not when the sheet is driven into harder ground. This could also be seen visually from the attended measurement on site.

Figure 3 Event time history

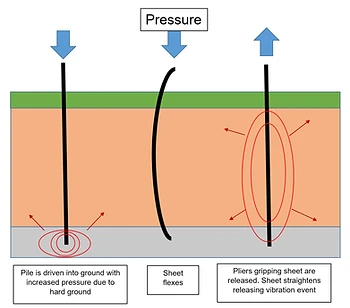
In the press in method varying pressure is applied to the pile.  Where there is hard ground the pressure is increased and this can cause the sheet to flex.  When the plier gripping the sheet is released the sheet straightens releasing energy as a transient vibration event.  This is illustrated in figure 4 below.

When working in areas sensitive to vibration, and where possible, pressure should be released slowly to reduce the impact of sheet piles straightening.

By having the M60 vibration monitor on site, they were able to accurately identify the source of vibration and have visible data to back it up.

References:
Ground-borne vibrations due to press-in piling operations
D.J. Rockhill, M.D. Bolton and D.J. White Cambridge University Engineering Depart

Smart cities – air quality

Air Quality & Dust

Practicalities of rolling out air quality sensor networks – Harnessing smart city infrastructure

Poor air quality is a major issue in communities across the UK and it continues to climb the agenda with public awareness growing of the real detrimental health effects. In order to identify issues, it is important to be able to make accurate measurements to quantify the problem areas. Low-cost air quality sensor-based systems are becoming more popular as they now provide scientifically credible data at reasonable cost, have lower servicing requirements and they come in a form factor that means they can be deployed in roadside locations. Previously these issues have been dealt with by diffusion tubes, which are also low cost and small enough to be located anywhere. However, the disadvantage of diffusion tubes is the manpower required to deploy and collect them and the lack of temporal data to see problem days and times of the day. This high time resolution data is important for managing air quality.

Locating Sensor Based Monitors The systems require a secure location to mount them which in a city/town centre is not always easy to find. They also need power to run effectively, as solar does not yet provide the supply in the UK to run year-round without major compromises to the data collection rates and quality. Finally, these systems will need communications such as wifi, LAN or cellular coverage. These issues multiplied many times for a high-density network can be a challenge, but it is not a challenge unique to Air Quality sensors.

Our towns and communities are filling with ‘smart city’ infrastructure such as street lighting, charging points, bus shelters, mobile phone masts and much more. All of this hardware will have similar issues when it comes to locating them. If air quality sensors are considered with other infrastructure, then costs can be reduced significantly. If we take the rollout of 5G for example, this will require a huge investment in new hardware and many more sites will be required. It is estimated 40 to 50% of operating costs for mobile phone infrastructure is for rent paid to property owners for mast locations.  Adding air quality sensors to the mast could provide additional revenue and value for communities. 

With joined-up thinking air quality monitoring networks can be rolled out sooner and more efficiently. This will enable decision-makers to tackle the issue more effectively to protect us all from the serious adverse health effects of poor air quality.

Aerial footage of Cemex Barrington Chimney being demolished

Project Updates

In 2018, our team took out their drone to capture some aerial footage of the explosive demolition of Barrington Chimney (CEMEX) in Cambridgeshire.  

Erith is commissioned on site to undertake the controlled demolition, and with Swantest, they were using Campbell Associates remote, cloud-based environmental monitoring solution to measure the impacts on the environment, providing real-time data, including SMS and email alerts.

The 58-year-old chimney was toppled by Erith with explosives, a 56m (184ft) tall chimney overlooking the peaceful Barrington Village. 

Environmental monitors were installed on the north, east, south and west boundaries of the site to measure the impact of the demolition on the environment. Swantest chooses Campbell Associates to supply the Sonitus Cloud solution, using the Aeroqual | Dust Sentry for Mcerts PM10 monitoring, the AVA | Trace M80 for vibration monitoring (with 8 months battery life), and the (just supply power) Sonitus Systems EM2030 Noise Monitor. 

Today with new technologies, we can connect from anywhere in the world with remote mobile connections, allowing us to see data, audio, and video in real-time. These technologies can be implemented into small aerial drones, environmental monitors and vehicles.

Ferrybridge power station | demolition monitoring

Demolition Resources

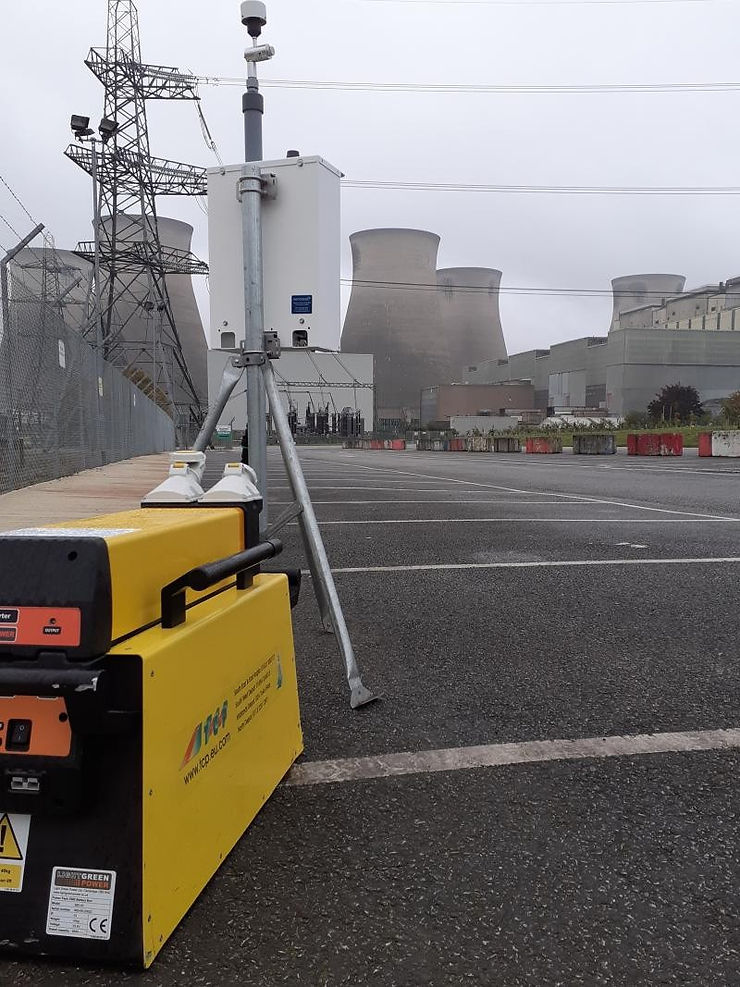
Campbell Associates have been assisting civil engineer giants Keltbray with their environmental monitoring with their demolition and clearing of the power stations at Ferrybridge, West Yorkshire.

The coal-fired towers were situated on the River Aire in West Yorkshire, next to the junction of the M62 and A1 motorways. They will have been a looming landmark on the landscape for more than 50 years for many a traveller of those roads. But these towers have been decommissioned and need to be brought to the ground after the power stations closure in 2016. The site is set to be cleared by 2021.

Keltbray’s challenge on the project was to easily and effectively monitor noise, vibration and dust emissions generated by their activity. They needed to be able to remotely access the data gathered from across the project and easily download the reports.

They chose the Sonitus noise, AVA vibration & Aeroqual Dust Monitor which proved to be uncomplicated and cost-effective; a total of 15 monitors across the site. During the cooling tower blowdown in June 2019 and October 2019 additional dust monitors were required to measure the aftereffects. With the level of interest, the project was drawing, large crowds of on-lookers were expected during the cooling towers blowdown meaning the safety of the public was paramount.

The monitors still provide Keltbray with reliable, accurate measurement data stored in real-time which they can use to keep a clear picture of what is and was happening on site. With the additional feature of trigger alerts when pre-set levels are exceeded; they are confident in their monitoring. 

How does aeroqual obtain accurate results from sensor systems?

Air Quality & Dust

Electrochemical and solid state sensors to detect Nitrogen Dioxide at ppb levels have been available for many years, but the problem has always been their near 100% cross response to ozone. This is not helped by the way Ozone and Nitrogen Dioxide mirror each other, with one dropping as the other rises, so their combined value can be meaningless. One way around this is to measure Ozone and subtract its contribution from the combined value. However, most sensors for ozone have a near 100% response to Nitrogen Dioxide. The relative difference in response to the two gases by two sensors has been used to estimate both, but this requires complex web-based algorithms and results can be variable. More recently some sensors have been developed which use an Ozone “filter” above the sensor to remove Ozone and therefore its cross response, but this has been shown to deteriorate with time, so that their correlation to reference analysers deteriorates rapidly as the ozone cross response of the sensor increases. It also reduces the response to Nitrogen Dioxide, especially if a thicker layer is applied to reduce deterioration.

The solution is to use an ozone sensor which measures ozone without NO2 cross-response. This is achieved by Aeroqual’s unique, patented GSS (Gas Sensitive Semiconductor) sensor. Not only is it specific to Ozone, its unique ABC (Automatic Baseline Correction) technology means its calibration stays stable long-term. We can therefore measure the sum of the Nitrogen Dioxide and Ozone concentrations with one sensor and Ozone with another. Accurate Nitrogen Dioxide values can therefore be calculated live, within the instrument and without the need for web-based algorithms. As a result, co-location studies have repeatedly shown correlation between the AQS and bigger and more expensive reference analysers with an R2 better than 0.95.

You may also be interested in the articles below:

Measuring high noise levels at a clay pigeon shooting range

Noise

MEASURING HIGH NOISE LEVELS

The Campbell Associates team attended a clay pigeon shooting range as part of an experiment to capture accurate high noise levels and sound pressure levels. Measurements were taken from various shotguns at a distance of 0.5m from the trigger, using a sound level meter designed for high sound pressure level measurement.

This type of noise measurement is sometimes required to assess the hearing protection used by individuals participating in gun-related leisure activities, where exposure to impulse noise can be significant.

The sound level meter used during the experiment was tested in three configurations to assess its suitability for high SPL measurement:

  1. The standard meter with a 140dB full-scale measurement range
  2. The standard meter in high-level mode, increasing the full-scale range to 150dB
  3. The standard meter fitted with a quarter-inch high-level microphone capsule, extending the measurement range to 160dB

The Results:

  1. In the standard measurement mode, the system frequently overloaded when the microphone was positioned closer than 1 metre from the gun being fired, highlighting the challenges of measuring extreme noise levels at shooting ranges.

Figure 1.

  1. How does a high range option work – How do you get an extra 10dB from a standard ½” microphone?

When the extended measurement range is activated, the standard 200V microphone has its polarisation voltage reduced from 200V to approximately 70V. This reduces microphone sensitivity by 10dB, allowing the instrument to measure peak sound pressure levels up to 150dB.

This change in polarisation voltage causes a small variation in the microphone’s frequency response. However, this is automatically compensated for when the high-range measurement mode is selected. Corrections are specific to each microphone type and should not be mixed when performing precision acoustic measurements.

With this option activated, most high noise level measurements were achievable using the sound level meter.

Figure 2

However, at a distance of 0.5 metres from the gun, particularly when using heavier shot, the sound level meter still experienced overloads, with measured levels exceeding 150dBc peak.

  1. Using a quarter inch microphone

With the use of an adaptor, a ¼” microphone can be fitted onto a standard ½” preamplifier, enabling measurements to be taken using a standard sound level meter.

Using this configuration, it was possible to measure peak noise levels without overload, with the highest recorded level reaching 157.9dBc peak.

Figure 3.

Why quarter inch microphones?

Quarter-inch microphones are inherently lower in sensitivity than ½” microphones. Their smaller diaphragm surface area makes them less flexible, meaning the same sound pressure produces a lower output voltage from the microphone capsule.

This reduced voltage output is highly desirable for very high sound pressure level measurements, as excessive signal voltages are the primary cause of overloads during extreme noise measurement.

How to measure beyond 160dB?

1/8” Microphone: Enables measurements up to 175dB, or up to 178dB when used with a 120V preamplifier supply.

Preamplifier Voltage: For extreme sound pressure level measurement, it is essential not only to use a low-sensitivity microphone but also a high-voltage preamplifier capable of handling large signal voltages without clipping.