What is MCERTS and Why do you need a MCERTS approved Dust Monitor?

Air Quality & Dust

MCERTS is the certification scheme created by The Environment Agency for equipment, personnel and organisations. The aim of this scheme is to provide delivery vehicle for compliance with European Directives by regulating industrial emissions, monitoring data, equipment and personnel.

MCERTS certification indicates that the performance of the monitoring equipment has been tested under mixed environmental conditions and ensures that the accuracy, reliability and consistency meet the specifications set by the Environment Agency. 

When using equipment for monitoring  air quality/dust for regulatory purposes, it’s crucial to use equipment with MCERTS.

Dust particles can be spilt it various size categories for monitoring. Currently, the focus is PM10 and PM2.5 sized particles which refers to the size and diameter of the particle.

PM10 = 10 um in diameter

PM2.5 = 2.5 um in diameter.

PM = Particle Matter

What are the effects of breathing in dust (Particle Matter)?

PM10 particles can be inhaled into the lungs and cause adverse health effects.

PM2.5 has been linked to premature death, particularly in people who have chronic heart or lung diseases, and reduced lung function growth in children. They cause lung irritation and can worsen asthma and other related medical conditions. Long term exposure has more severe effects such as lung cancer and chronic bronchitis.

What does limits should I implement on my construction or demolition site?

According to IAQM guidance for construction and demolition sites and a recent report by King’s College that evaluated nine construction sites, a Site Action Level of 190 µg/m³ for PM10, measured as a 1-hour mean, is recommended.

Using MCerts-certified dust monitors focusing on PM10 particles, which are coarse particles measuring 10 µm in diameter and we are measuring dust deemed to cause significant health risks.

How can I measure PM10 & PM2.5?

Campbell Associates offer several solutions for MCERTS dust monitoring.

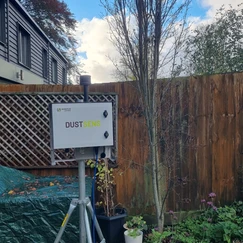
The DustSens DM30 monitor has MCERTS for both PM10 & PM2.5.  It provides real-time data alerts and mean average readings into a cloud platform. SMS & Email alerts are setup when exceedances have been hit, alerting workers on site to take action.

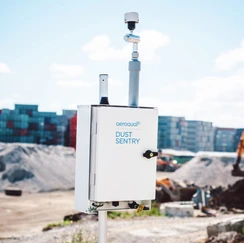
The Dust Sentry is another real-time monitor which is available in versions, with a MCERTS certificate for PM10 only & PM10/PM2.5. The monitor can also be upgraded to measure gases like NO2 and VOCs. Please get in touch to discuss your project requirements.
Understanding vibration monitoring and frequency limits

Vibration

Understanding Vibration Monitoring and Frequency Limits

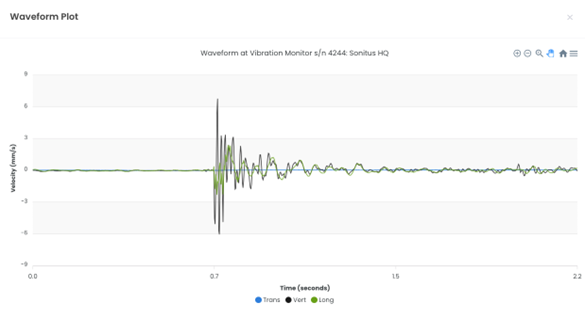
Effective vibration monitoring plays a critical role in managing risks and ensuring the structural integrity of buildings and infrastructure. However, it requires proper configuration and understanding of the tools and data to avoid common pitfalls. Below, we discuss key aspects of vibration monitoring, including the use of frequency graphs, trigger settings, and interpreting breaches, as demonstrated in the graph below.

Setting Triggers and Managing Data

When using vibration monitors, it is essential to set triggers correctly. The trigger should be designed for specific, one-off breach occurrences where the vibration limit is exceeded. This approach ensures the system captures the dominant frequency for each channel during a breach. However, care must be taken:

  • Avoid Unrealistic Trigger Settings: Setting overly sensitive triggers can generate excessive data streams, quickly consuming SIM data and potentially overloading the monitor’s memory. This can cause the monitor to stop functioning.
  • Purpose of Triggers: The system is intended to capture the frequency of a single, significant breach. This is because low-frequency vibrations tend to cause more damage than high-frequency vibrations. Properly configured triggers help identify these instances without overwhelming the system.

Frequency and Vibration Damage

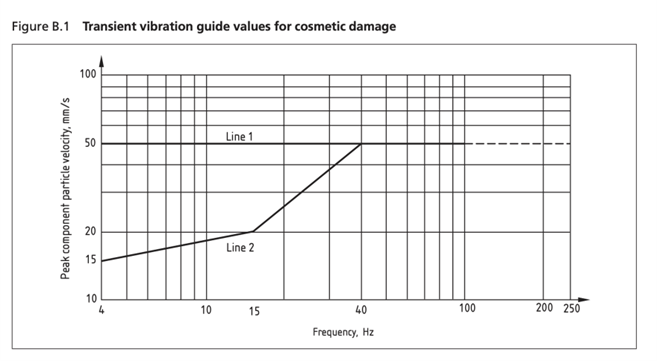
The impact of vibration varies significantly based on frequency. As shown in the graph below, low-frequency vibrations (e.g., around 4 Hz) are more likely to cause damage compared to higher frequencies (e.g., 40 Hz). This is reflected in the transient vibration guide values for cosmetic damage:

  • Line 1: Represents the general limit across frequencies.
  • Line 2: Shows how the maximum limit increases at certain frequencies, rising from 15 mm/s to as high as 50 mm/s.

This means that at higher frequencies, vibrations can exceed the default lowest limit (e.g., 15 mm/s) without necessarily causing damage. For example:

  • A reading of 7.29 mm/s at 46.87 Hz would not exceed the limit and would be considered safe.
  • A reading of 20 mm/s at 46.87 Hz would still fall within acceptable limits due to the frequency-dependent increase in thresholds.

Thus, while an alert might be triggered at the default 15 mm/s limit, further investigation using the frequency graph can reveal whether the breach is genuinely concerning or not.

Interpreting Data with Sonitus Cloud

The Sonitus Cloud platform captures velocity data in mm/s for each channel, enabling detailed analysis of vibration events:

  1. Frequency Plots: These plots provide insights into how the waveform decays over time. By analysing the decay pattern, you can:
    • Determine if the breach was a one-off occurrence.
    • Identify potential tampering, as tampered waveforms often differ significantly from expected patterns.
  2. Dominant Frequency Identification: The system pinpoints the dominant frequency during a breach, allowing for more precise assessment of its potential impact.

Practical Implications

For users monitoring sites with vibration-sensitive infrastructure, understanding these principles is essential:

  • Set realistic trigger levels to avoid unnecessary data overload.
  • Use frequency graphs to determine whether a breach poses a genuine risk.
  • Recognize that frequency-dependent limits provide greater flexibility for managing higher-frequency vibrations without unnecessary alarms.

By leveraging tools like Sonitus Cloud and interpreting frequency plots accurately, users can make informed decisions and maintain efficient, reliable monitoring systems.

Particulate matter – why do we monitor it?

Air Quality & Dust

Our health is incredibly important to us; without it we have nothing. If we can prevent ourselves from becoming unwell, wouldn’t we all take that opportunity? With increasing construction works around the country the importance of air quality and it’s health implications has become a prominent feature in the media. You might have heard of PM10, but what exactly is it and how does that affect our air quality?

PARTICULATE MATTER – ALL THE ANSWERS!

Air pollution or air quality is a very wide concept and can mean various things but are all related to our heath. When we talk about particulate air pollution we talk about an air-suspended mixture of both solid and liquid particles and these are all related to size and the possible harm they can do to the human body.

The size of the particles defines three classifications:

  1. ultrafine particles: <0.1µm in diameter;
  2. Fine: 0.1 to 2.5µm in diameter;
  3. Coarse: between 10µm and 2.5µm in diameter.

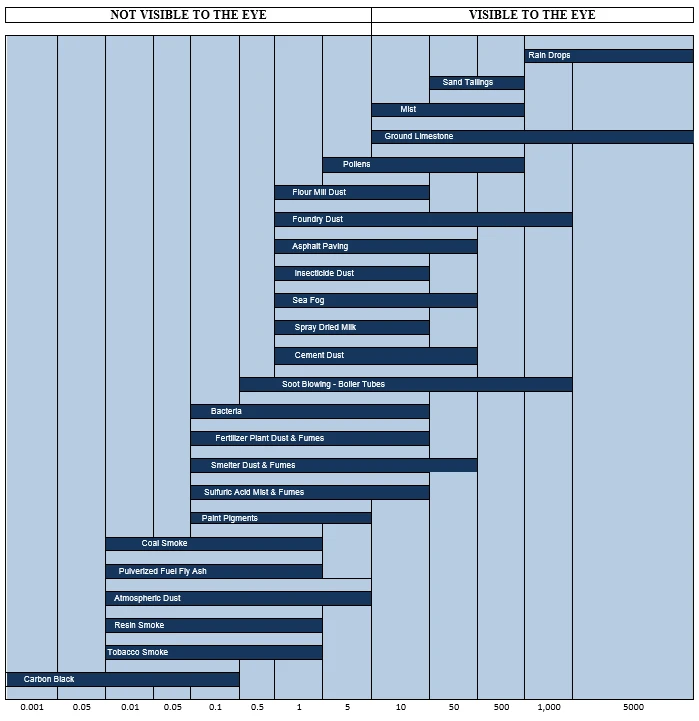
Local councils in general will only be interested in PM10. When monitoring PM10 all particles smaller than 10 µm are logged – which includes fine and ultrafine particles. These particles include dust, pollen and mould spores (PM10) and combustion particles, organic compounds and metals (PM2.5). The table below sums it all up and shows where particulate matter comes from.

The World Health Organisation (WHO) believes particles are affecting more people worldwide than any other pollutant. Damage to the respiratory and cardiovascular are one of the primary health effects. The small particles can easily penetrate in to the deepest parts of our lungs as well as access the gas exchange regions of the lung via diffusion.

As a result of the damaging health effects from PM10 the WHO recommend the exposure limit below – which is commonly the limit values that local councils use in their Code of Practice:

PM10: 50 ug/m3 24 hour mean

To control this limit on site, local councils demand higher limits in shorter time periods to make sure daily exposure limits won’t be exceeded. Often, they will ask for a 200 or 250 ug/m3 per 15-minute RED alert.

These guidelines can be hard to follow because of the many activities going on in all our mayor cities. The limits are therefore hard to meet in a whole but the understanding and seriousness of the issue is a great step forward. Monitoring certain activities that have a higher risk of producing these particles, like construction & demolition, will eventually lead to a cleaner and more sustainable environment.

Local governments don’t always acknowledge higher particle sizes are a threat because there is no direct health risk involved. As the table above points out these particles are visible to the human eye and therefore will end up in the nuisance category. This size is called Total Suspended Particles (TSP) which is everything above 10µm but can still affect health.

HOW CAN CAMPBELL ASSOCIATES ASSIST YOU?

When it comes to monitoring particulate matter (PM), Campbell Associates provides a complete and reliable solution designed to give you peace of mind. Our range of dust and air quality monitors, which form part of our NVD suite, are engineered to accurately measure PM levels, including PM₁₀ and PM₂.₅.

This crucial data is sent in real-time to our web-based platform, Sonitus Cloud, enabling you to view live readings, access historical data, and receive instant alerts if levels exceed set limits. With our monitors, you not only ensure compliance with environmental regulations but also gain actionable insights to protect your site, your workers, and the surrounding community from the harmful effects of airborne particles.